JAPANESE CANDLESTICK FORMATIONS.
JAPANESE CANDLESTICK FORMATIONS
BASIC CANDLESTICK PATTERNS – SPINNING TOPS
A spinning top is one of the most commonly seen candlestick patterns. This type of pattern is often regarded as neutral and indicates indecision between buyers and sellers and the future movements of an asset. We can see above that the body of the spinning top is small despite their possibly being a large amount of price fluctuation during the day. It is also either green, red, black or white in colour, indicating an upward or downward sentiment. Traders use the presence of a spinning top to predict whether there is an impending up or downward trend. For example if after a long uptrend a spinning top forms this generally means that buyers have begun to lose interest and it is indicative of an impending downtrend. The opposite is also true.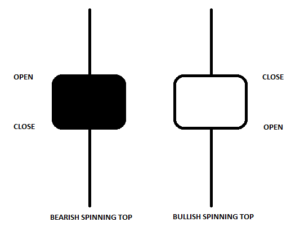
BASIC CANDLESTICK PATTERNS – MARUBOZU
Marubozu pattern at first glance looks very similar to the spinning top candlestick formation described above. The main differences between the two are that the marubozu are larger in size and unlike spinning tops do not have shadows. Again the two colors, black and white, indicate whether the market is bullish or bearish.

We can see for example in a bullish market that the open price = low price and that the high price = close price. The green marubozu pattern is often seen as the first part of a bullish continuation or a bullish reversal pattern and so traders will buy into a market in which they see a bullish marubozu. The opposite here is the bearish marubozu which is seen in red. In this case the low price = close price and open price = high price. A bearish marubozu implies an impending bearish reversal or a bearish continuation and so many traders use the black marubozu as an indication to sell into the market.
BASIC CANDLESTICK PATTERNS – DOJI
Doji candlesticks are said to be “neutral” as they do not indicate a definitive upward or downward trend and so indicate indecision amongst traders. Doji candlesticks are in a way similar to spinning top candlesticks in that they have very small bodies, in the case of Doji the body is simply a bar as seen below. Also similar to spinning tops, Doji candlestick patterns can be seen to display long shadows.
There are four main types of Doji candlesticks;
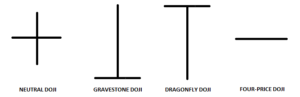
First let us look at the long-legged Doji (NEUTRAL DOJI)
Here we can see that opening and closing prices were essentially equal. This long legged Doji implies that there is almost equilibrium between supply and demand and that there may be a turning point in the prices direction approaching.
Next there is the dragonfly Doji – similar to the long legged Doji the dragonfly Doji also forms when an assets opening and closing prices are equal. The long bottom shadow however means that this equilibrium took place at the high of the day. Again it implies that the direction of the trend is nearing a major breakthrough with the longer lower shadow implying the possible reversal of a bearish trend.
A gravestone Doji is essentially the opposite of the dragonfly Doji explained above. It forms when the opening and closing prices are equal and occur at the end of the day. The long upper shadow implies that the days buying pressure was countered by sellers and that a bullish uptrend is about to be reversed.
Finally a four price Doji is a candlestick formation where the day’s high, low, open and close price were all equal. This is the most neutral of all the Doji candlestick formations and does not occur often. It is seen mostly in times where there is a very low volume of trading such as after hours and is often disregarded by traders as being a result of bad data.
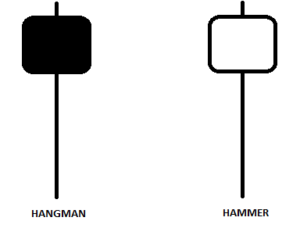
The hammer and hanging man look very similar with short bodies and long lower tails, but they have very different indications. The hammer, which can be seen above on the left in green, is a bullish reversal pattern that forms during a downtrend. When prices are falling hammers signal that the support level has been approached and prices may well begin to rise again. Traders often take a hammer man as in indication of an impending price rise, but it is always safer to wait a while and confirm a bullish trend before buying. The hanging man, which can be seen above in red, is the opposite of the hammer man. It is a bearish reversal pattern that often is seen to mark a top or strong resistance. When price rises the formation of a hanging man is often taken by traders as an indication that selling pressure is larger than upward buying pressure.
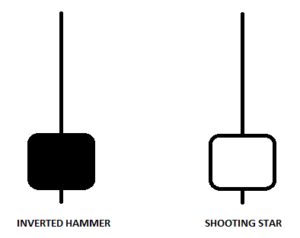
BASIC CANDLESTICK PATTERNS: INVERTED HAMMER & SHOOTING STAR
The inverted hammer occurs when a falling price indicates the possibility of a reversal. Its long upper shadow as seen below showing us that buyers are attempting to counter the downwards pressure and were able to close the session near its open as opposed allowing the price to be pushed down further. The shooting star is a bearish reversal pattern that looks identical to the inverted hammer but occurs when prices have been rising. Its shape indicates that the price opened at its low, rallied, but pulled back to the bottom. Conversely to the inverted hammer the shooting star shows us that sellers countered the upward pressure of buyers and were able to keep the day’s close almost equal to its open and avoid any further upward pressure.