LEADING INDICATORS (RSI, STOCHASTIC, BOLLINGER BANDS, AND FIBONACCI SEQUENCE.
LEADING INDICATORS
As mentioned before leading indicators will change in advance of expected economic trends; they are often used to predict future movements but not always necessarily accurate. Now that we have discussed moving averages, an example of a lagging indicator, let us move on to the Relative Strength Index which is a type of leading indicator.
RELATIVE STRENGTH INDEX(RSI)
The Relative Strength Index [RSI] determines the speed and change of price movements; it allows traders to measure the buying or selling momentum of a product. RSI oscillates between 0 and 100 and generally a market is thought to be overbought once the RSI approaches 70. This is a good indication that the asset may be getting overvalued and is a good candidate for a pullback. Conversely in instances where the RSI approaches 30, it is an indication the market may be oversold and therefore the asset is likely to become undervalued.
WHAT DOES OVERBOUGHT MEAN?
In technical analysis, overbought is a situation in which the price of a market has risen to such a degree – usually on high volume – that an oscillator, for example an RSI, has reached its upper bound. Put more simply it is when the demand for a product pushes the price of a market up to unjustifiable levels. Generally when a product is overbought it is an indication that the market is becoming overvalued and may experience a pullback.
WHAT DOES OVERSOLD MEAN?
Oversold is simply the opposite to overbought. Oversold is a condition in which the price of a market has declined too steeply and too fast in relation to underlying fundamental factors. This condition is usually a result of market overreaction or panic selling.
Overselling is generally interpreted as a sign that the price of the asset is becoming undervalued and may represent a buying opportunity for investors. Hopefully it is now more clear to you what it means to say an asset is overbought or oversold, but please remember that determining the degree in which an asset is overbought or oversold is very subjective and can differ between traders.
Stochastic Oscillator is another example of a leading indicator; it is a momentum indicator that measures the speed of change of price or the impulse of price. It does this by comparing an asset’s closing price against its price range over a given time period. Similar to RSI Stochastic Oscillators also have levels that indicates potential trends or points of entry or exit
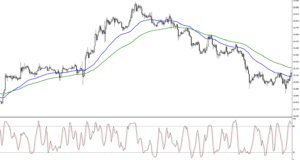
Traders will often look to sell when the Stochastic Oscillator line rises above 80m predicting that it will inevitably then fall back below. Traders will also look to buy when the level falls below 20 predicting that it will increase above this level. Another way of utilising stochastic oscillators is to watch timing trades. The graph below gives an example of this;
%K = Black
%D = Red
%K = (Current Close – Lowest Low)/ (Highest High Lowest Low) * 100
%D = 3-day SMA of %K
%K = Black %D = Red %K = (Current Close – Lowest Low)/ (Highest High Lowest Low) * 100 %D = 3-day SMA of %K
The %K is called the faster moving of the two lines and compares the latest closing price to the recent trading range. %D is a signal line calculated by smoothing out %K; it is a 3-day simple moving average of %K which is plotted alongside %K to act as a signal or trigger line. Traders will look to sell when the %K (Fast) line shifts below the %D (Slow) line and will look to buy when the %K line shifts over the %D line. The theory behind this indicator is that in an upward trending market, prices tend to close near their high, and during a downward trending market, prices tend to close near their low. Transaction signals occur when the %K crosses through a three-period moving average called the “%D”. The sensitivity of the oscillator can be adjusted by changing the time period for the %D or %K lines.
BOLLINGER BANDS
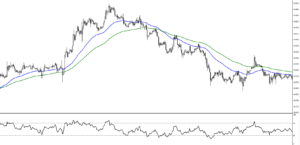
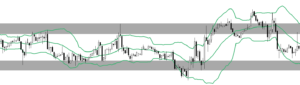
Bollinger bands is an analytical tool used by traders to identify a market’s volatility and looks at the levels of current prices relative to previous trades.
We can see from the above graph that in an instance where there is little volatility the bands contract and as the market becomes increasingly volatile the bands expand. It may be simpler to look at Bollinger bands as a form of support and resistance.
It may be simpler to look at Bollinger bands as a form of support and resistance. Often what is seen with Bollinger bands is that as the price deviates within the band it often tends to return back to a middle ground; this is what is known as the Bollinger Bounce.
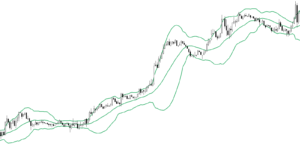
Often the bands can be seen to “squeeze” together such as in the graph below:
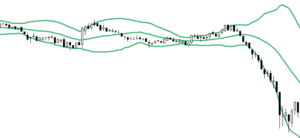
Many traders see a band squeeze as an indication that there is a pending breakout in the market. If the graph is seen to move towards the upper band then an upwards trend is usually expected. The opposite is true when the candlestick is seen to be approaching the lower bound. Many traders see a band squeeze as an indication that there is a pending breakout in the market. If the graph is seen to move towards the upper band then an upwards trend is usually expected. The opposite is true when the candlestick is seen to be approaching the lower bound.
An example of a “breakout can be seen above”:
It is not an often occurrence to see a Bollinger squeeze; when looking at a 15 minute candlestick chart it will be experienced only a couple of times a week.
FIBONACCI SEQUENCE
Fibonacci sequence is used widely in many different industries in the world which is why it may sound the most familiar to you out of all the technical analysis tools we have covered so far.
Leonard Fibonacci was an Italian mathematician (1200 AD) who discovered a simple sequence of numbers (Fibonacci numbers) that are used today in what is called Fibonacci retracement as a popular technical analysis tool.
Fibonacci Numbers are as follows; 0, 1, 1, 2, 3, 5, 8, 13, 21, 34, 55 and so on.
More important than the sequence its self is the mathematical relationship between the numbers. It is the quotient of any two adjacent numbers in the sequence that is what’s important to us; each term in this sequence is the sum of the two preceding terms.
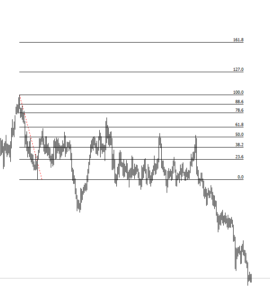
Fibonacci retracement works by taking two extreme points on a chart and dividing the vertical distance between the two points by what are known as the Fibonacci ratios. These ratios are 23.6%, 38.2%, 50%, 61.8% and 100% and the quotient of adjacent numbers in the sequence. Once these calculations have been done and the point defined they are noted on the graph using horizontal lines. These lines are interpreted by many traders as levels of support and resistance and are also used to help identify strategic places for transactions to be placed, and target prices or stop losses to be selected.