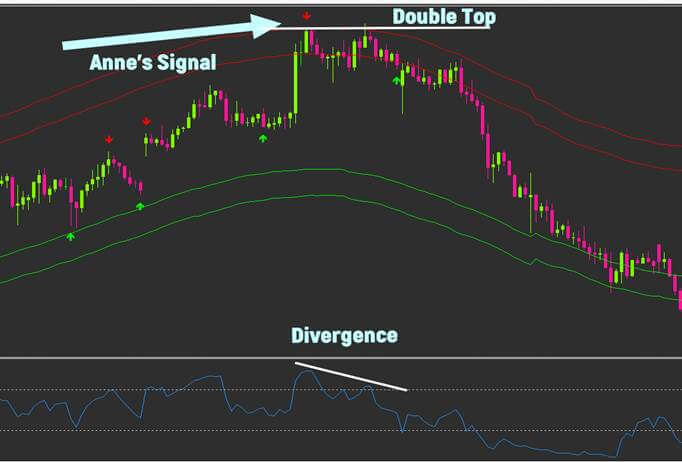
The Anne’s strategy is a reversal strategy. It will never give you a trade with the trend. The whole point of this strategy is to capture the reversals in the market. This can be a very risky tactic, but by employing an appropriate money management system it can deliver some impressive results.
The above photo above demonstrates an ideal Anne’s Signal with a Double Top and Divergence. This kind of set-up is a textbook trade. When Price Action and the Binary Destroyer both line up, it’s a powerful combination. Look for this.
However, perfect set-ups are infrequent so learning about Price Action will help identify close matches that are also profitable.
So let’s cover the basics needed to master this strategy.
Divergence in a Relative Strength Index (RSI)
Simply put, Divergence in an RSI is when the RSI is doing the opposite to what the price is doing on the charts. The momentum of the market has a huge influence in trading. When there is a strong uptrend, it means the buying momentum is strong (a lot of buyers in the market) and this is the opposite for a downtrend (a lot of sellers in the market). Eventually, during every trend, the momentum and price will slow down and either pullback or change direction. The Relative Strength Index or RSI for short is a momentum oscillator indicator that measures the momentum in price using a line which swings from over bought to oversold.
As you can see from the example above, we have two key levels on the RSI, the 70 and 30. These levels can be changed to suit each trader; they represent when the market has reached an oversold level or overbought level. It’s important to note that when the price does cross over the 30 level (oversold), it doesn’t mean that the price will now reverse into an uptrend; it is only a guide. To help you decide, when we get an Anne Strategy Signal, you can use the RSI to measure how strong or weak the momentum is in the market.
Above you can see a perfect example of momentum slowing down and Price Action playing out. By looking at the RSI, you can see the blue line on the RSI is making lower lows. This means the momentum is slowing down in the market, but it doesn’t mean the price will change direction. It just means the price is slowing down and we should look to use our strategy to get into a trade.
Can you see how the price was going sideways at the same time the RSI was going lower. This is also a very clear sign the market is getting weaker. Count how many candles are in that blue box!
We have 16 candles in that box just going sideways. This is the 1 hour time frame so for 16 hours the price didn’t do anything, it just went sideways. When you include the momentum slowing down in the RSI, you can now see exactly why the price dropped hard from that level.
This is called reading what’s in front of you on the charts. Trade what you see not what you think.
Price was failing to go any higher at that level and instead went sideways for 16 hours. At the same time the momentum was getting weaker in the market, until eventually the price crashed. You could almost see that coming.
Let’s look at one more example.
This is actually a clearer example of momentum slowing down in the market, and this is why I say divergence is a window into the future.
From looking at the charts you would naturally assume that price would continue down. We created a lower low, and we had a lot of red bearish candle stick patterns giving us a false idea that price would continue down.
At the same time the candle sticks were going lower, we were actually creating higher lows in the RSI. This is called divergence. This shows that momentum was slowing down in the market and could potentially change direction. When you spot this sort of pattern happening, it’s a sign that the market is slowing down, and this is when we would look to enter a trade using our strategy.
Remember that we can’t rely on divergence alone. We use it alongside our other indicators.
Also please note that the RSI has to cross either the overbought level or oversold level to count as divergence. You can’t count divergence that happens when the RSI line is in the middle.
This website uses cookies to improve your experience. We'll assume you're ok with this, but you can opt-out if you wish. Cookie settingsACCEPT
Privacy & Cookies Policy
Privacy Overview
This website uses cookies to improve your experience while you navigate through the website. Out of these cookies, the cookies that are categorized as necessary are stored on your browser as they are essential for the working of basic functionalities...
Necessary cookies are absolutely essential for the website to function properly. This category only includes cookies that ensures basic functionalities and security features of the website. These cookies do not store any personal information.
Any cookies that may not be particularly necessary for the website to function and is used specifically to collect user personal data via analytics, ads, other embedded contents are termed as non-necessary cookies. It is mandatory to procure user consent prior to running these cookies on your website.