Login
Accessing this course requires a login. Please enter your credentials below!
CHART PATTERNS
Technical analysis, like we said before, is not just about charts. It does, however, rely heavily on them and often uses chart patterns to assist in making trading decisions. The underlying theory is that traders often expect chart patterns to repeat, and this prediction is what presents them with various trading opportunities. The most common chart patterns are: Symmetrical Triangles, Ascending Triangles,
Descending Triangles, Double Top, Double Bottom, Head and Shoulders, Reverse Head and Shoulders
CHART PATTERNS – TRIANGLES
Triangles represent continuation patterns and there are three main types;
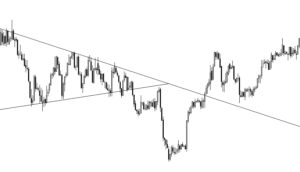
SYMMETRICAL TRIANGLES
Neutral pattern signalling breakout to either side, though usually a continuation pattern so how do you spot a systematic triangle pattern? Symmetrical triangles have distinct pattern signs, Upper trend line downwards sloping, Lower trend line upward sloping, Both trend lines converging together, Breakout to upside or downside being confirmation of trend in that direction
The slope of the price’s highs and the slope of the price’s lows converge together to a point where it looks like a triangle. In the below example of a systematic triangle the market is making lower highs and higher lows. This type of price activity is called consolidation.
Traders who use symmetrical triangles are often looking for a breakout; i.e. when the pattern reaches a stage where the price moves decisively in one direction or the other. Much like we explained in the Bollinger “squeeze” a breakout often occurs after a consolidation as seen below; traders wait for the price to either move above the top trend line or below the bottom trend line.
ASCENDING TRIANGLES
Bullish continuation pattern, Ascending triangles also have pattern traits with which you can identify it. Upper trend line horizontal / flat Lower trend line upward sloping both trend lines converging together Breakout to the upside through upper resistance. Ascending triangles are experienced in instances where there is a resistance level coupled with a slope of higher lows. Again traders will often wait to see if the price finally breaks the resistance level, at which point the price could breakout decisively to the upside as seen below. The alternative occurs when the resistance level proves too strong for an upward break through and the price move reverses downwards.

DESCENDING TRIANGLES
Bearish continuation pattern finally there are descending triangles; Descending triangles are essentially the opposite of ascending triangles.
Upper trend line downwards sloping, Lower trend line horizontal / flat, both trend lines converging together, Breakout to the downside through lower support
Above we can see a descending series of highs, which forms the upper line. The lower line is a support level in which the price cannot seem to move below.
Unlike with ascending triangles where traders are waiting for an uptrend breakthrough traders witnessing a descending triangle are expecting a bearish market and are waiting to see if the price eventually makes a breakout to the downside through the support level.
The alternative scenario will occur when the support level proves too strong for a downward break; the price will then be seen to “bounce” off of the support level and generally begin in an upward movement
DOUBLE TOPS – REVERSAL PATTERN

A double top is a bearish reversal pattern that is formed after there is an extended move up.
The “tops”, as seen above, are peaks which are formed when the price hits a resistance level that appears it is unable to break. We can see in the diagram above that having bounced off the support level slightly the price then returns to re-test the support again. If the price is unable to break through the support level for a second time and is seen to bounce off of that level again, a DOUBLE top chart pattern has been formed. Referring back to the diagram above again we can see that the 2nd “top” was unable to break the high of the 1st. Traders often interpret this as a strong sign that a reversal is going to occur as this movement implies that the buying pressure is lessening. When using double tops as a form of analysis traders will often look to go short below the level which is referred to as the “neck line”. When the price level falls below the neckline traders will expect the reversal of an upward trend.
DOUBLE BOTTOM – REVERSAL PATTERN
A double bottom is the opposite of a double top. It is a bullish trend reversal formation, meaning that unlike with double tops traders are now looking for the price to reverse upwards after it has been coming down.

HEAD AND SHOULDERS
Head and shoulders is another form of a reversal pattern which has two main types; Head and shoulders – Pattern formation that indicates a reversal in an uptrend [bearish] Inverse Head and Shoulders – Pattern formation signalling a reverse in a downtrend [bullish]
Head and Shoulders is formed by a peak, known as the “shoulder” which is then followed by another higher peak, the “head”. Following on from this high peak [head] another shoulder is seen depicting a lower peak.
Finally we can see that there is a neckline which is drawn by connecting the lowest points of the two troughs. Although in this case the neckline is a straight line it can be either upwards or downwards sloping.
Much the same as double bottom and top formations traders using head and shoulders will also look to sell once the price falls just below the neckline as it is thought to imply an impending downward trend.

REVERSE HEAD AND SHOULDERS
A reverse head and shoulders is pretty self-explanatory; it’s a head and shoulders formation, in reverse. An inverse head and shoulders formation is a bullish reversal pattern and so traders will look to buy when the price increases above the neck line as they will be expecting an upward trend break through.