Support & Resistance

Before we jump on the charts and start looking at the practical side of Support & Resistance, its important we cover the theory part first. Teaching Support & Resistance can be a very controversial subject as so many traders teach it in the different ways. The main reason for this is because support & resistance can be measured in many different ways. A good example of this is when I asked a programmer to build me a support & resistance indicator and his reply was how do you want the indicator to measure support & resistance? This stopped me in my tracks, because I realised then, you can draw Support & Resistance in many different ways. A quick google search confirmed this with over 64,000,000 search results and many different Support & Resistance terms.

Now do not be worried! Your not going to be spending the rest of your time here learning all the different terms, and then being questioned about them at a later date. If you know me by now, you know I like to keep trading simple. I have a saying in trading that chart time is everything. The goal here is to be able to spot the Support & Resistance levels on your charts, not name everyone of them. The problem with teaching trading, is many different people will call the same thing, many different names and this causes massive confusion. I have lost count of the amount of hours I have lost listening to other traders trying to explain how they trade, to only find out its just Support & Resistance.

A very good example of this is below. I have took this screenshot from a very famous SMC trader who teachers traders to trade. Now I’m going to tell you first that I have the upmost respect to every trader who trades. We are all in this industry to make money together, so how people trade is totally up to them. I will never dis-respect anyone, and will always welcome other traders with open arms regardless of how they trade. However this is a very good example of what I’m trying to teach you.


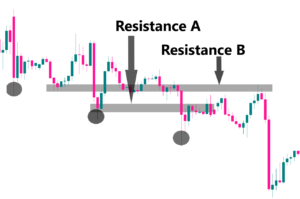
The example above is a buy trade based of a trading method called Smart Money Concepts or SMC for short. This method of trading is considered a very technical way of trading, and very confusing to understand. The method behind the strategy is to identify where the institutions would buy and sell from. SMC uses words such as Order blocks, FVG, Imbalances, LIQ, BOS, COCH etc. Now I’m not saying this method doesn’t work because clearly it does as many traders have mastered it, but now let me show you what I see on the charts.


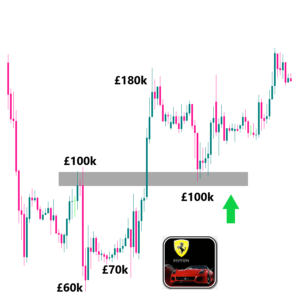
The same setup and same example as the previous one. However even though we would take the same trade as each other, my method and what I see is different to his. Lets firstly start off by looking at the red arrow. For me this is a perfect sell with the trend. As price comes up to the ‘red arrow’ I can clearly see that price is in a down trend. I can see this by firstly looking at the support line which is broken, but secondly also the lower lows and lower highs being formed. Combine this all together and you have a perfect example of a break and retest of a support line and a sell with the trend. Now the next part is very important, but also very simple once you break it down. For price to be into a down trend, you need lower lows and lower highs, however from the example above, you can see that price really struggled to go any lower than the previous low. This would indicate to me that perhaps there is a major a support level there, and buyers are starting to come back into the market.

This is normally when I would go down to the lower time frames and look for resistance to be broken to the upside. This is because if price is in a down trend then support will get broken, and if price is in an uptrend then resistance will get broken. As you can see by the green arrow, that in fact resistance did get broken and then price retouched that level to create a break-retest to the upside. When you line all the dots together now from price failing to go lower, price then creating a higher high and breaking a resistance level, you can see why a buy at that green arrow was perfect. For me I could see two possible entry points on that chart. Both with the trend. However the important thing to remember is every trader will call and see things differently on the charts. Where a trader might see an SMC setup, I see Support & Resistance.

At the end of the day no one is right and no one is wrong. The goal of trading is to make money, and how you make that money is up to you. You just have to remember that the Forex Market has been around for generations, so what you learn on the charts has been around for years. If you went to school to learn to trade, then the teacher who taught you was once a student of their teacher. Then that teacher was a student of their teacher. Then before you know it after 50 years the original strategy, has been taught and changed to create many more different strategies, as each teacher adds their own personal touch to it.

A famous saying is  “The thing that hath been, it is that which shall be; and that which is done is that which shall be done: and there is no new thing under the sun.” 

After you spend years on the charts and build up the experience you will learn to understand this. Many traders talk to me with words I do not understand, however once I see on the charts what they are doing it all makes sense. Going back to the example above. It does not matter what you call it, the key thing here is about identifying the levels and being being able to profit from them.

We covered this earlier in the course where I talked about the Rabbit, and the Duck illusion and how some people see a duck and others see a rabbit. The example above is a perfect example of that. Some see an SMC concept, and others see a Support & Resistance concept. The problem gets worse when you see both concepts. I have taught thousands of traders, and a big problem traders have is sometimes knowing too much. I know this sounds strange at first because we should never stop learning, but sometimes when I’m teaching Support & Resistance, some traders will start talking about something else to me. This is one of the reasons why I do not follow anyone else, as It will just confuse my vision and goals in trading.

Support Vs Resistance

There are many different types of Support & Resistance levels and many different names for him. I did a quick search on google to see just how many there was, and I ended up getting lost down a path of confusion. The problem is one website says a support line is this name, and another website said its called something else. Off topic I was talking to a member this morning and he was trying to learn all the candlestick names. The real term for candlesticks are Japanese Candlesticks, and I believe off the top of my head there are around 50 patterns you can learn. I said to the member that I have been trading for nearly 8 years and I can probably name 5 candlestick patterns. At the end of the day learning all the candlestick names, will not make you profitable. Yes it will make you sound intelligent to your trading friends, but learning every name is not going to make you a better trader. What makes someone a better trader is spending the time on the charts, not spending their time reading books or candlestick names. So going back to support and resistance it does not matter what traders call them, the key is being able to see them on your charts, and profit from them.

Support & Resistance are actually just psychological levels. Remember what I said earlier about price moves because of buyers and sellers. The more people buy a currency pair, then the price goes up. The more people sell a currency pair then price goes down. Its actually called Supply and Demand. You have to look at trading for what it truly is… which is price!

Let’s use a few examples of market participants to explain the psychology behind support and resistance.

First let’s assume there are buyers who’ve been buying a stock close to a support area. Let’s say that support level is £50. They buy some stock at £50 and now it moves up and away from that level to £55. The buyers are happy and want to buy more stock at £50, but not £55. They decide if the price moves back down to £50, they will buy more. They’re creating demand at the £50 level.

Let’s take another group of investors. These are the people that were uncommitted. They were thinking about buying the stock at £50 but never “pulled the trigger.” Now the stock is at £55 and they regret not buying it. They decide that if it gets to £50 again, they will not make the same mistake and they will buy the stock this time. This creates potential demand.

The third group bought the stock below £50; let’s say they bought it at £40. When the stock got to £50, they sold their stock, only to watch it go to £55. Now they want to re-establish their long positions and want to buy it back at the same price they sold it, £50. They’ve changed their sentiment from sellers to buyers. They regret selling it and want to right that wrong. This creates more demand.

Now let’s change things up to help understand resistance. Take all the above participants and say they all own the stock at £50. Imagine yourself as one of the owners at £50. The stock goes to £55 and you don’t sell. Now the stock goes back to £50, where you own it. What are you feeling? Regret for not selling it at £55? Now it goes back to £55 and you sell as much as you can this time. So do the other owners of the stock. The stock can’t get past £55 and retreats. There are at least 3 groups of stock owners that are trying to sell their supply at £55. This creates a resistance level at £55.

Now lets look what this means on the charts. I have used a Ferrari as an example for this. Lets say you buy a Ferrari at £100,000 and you love it. You drive it every day and love showing it off to your friends. All of a sudden you see the price of your car drop to £60,000, and you start to panic as you are now £40,000 down. The next month price starts to climb to £70,000 and you decide you are going to sell it and put the money in your bank as you believe its a safer option than keep losing money all the time. A car collector who specialises in Ferraris sees you selling your Ferrari at £70,000 and thinks that is a cheap, and decides to buy it. Now imagine for a minute that same scenario happens a thousand times. This creates demand as all the specialist rush to buy Ferraris, and its this demand that increases the price. There is more demand than supply so the price will inevitably increase.

Price then increases past the £100,000 mark all the way to £180,000. Now what do you think the Ferrari Specialists are going to do now after buying their cars for £70,000? Of course they are going to sell them for profit. So as all the specialists start to sell their Ferraris which creates supply in the market. However there isn’t really much demand for these cars now as everyone just seen the value go from £60,000 to £180,000 so buying at that price would be stupid. Now you have a flooded market of overpriced Ferraris that no one wants to buy, so naturally the price decreases and falls back to its original price of £100,000.

During this whole time, you have been watching the market, and you think to yourself, I should have never of sold my Ferrari in the first place as it went up to £180,000. So you being you, you rush to buy your car back at £100,000 and this in turn creates demand again. However the demand is no longer at £60-£70,000, its now at £100,000. This is essentially how the market functions and how you get a typical up trend in the market.

Its so important that you understand this concept because as you learn Support & Resistance you will learn about where is the best price to take a trade. Going back to the example above, can you see how all this supply and demand in the market has created a support and resistance level? This concept of Support & Resistance all starts with the human emotion, and its the key fundamentals of how the market functions.

Best Price

Looking at the example above we have two Resistance levels on the charts. Resistance level A and resistance level B. Now before I explain to you why Resistance level B was the best resistance level to sell from, I want to see if you can work it out for yourself. Going over what I have just explained to you about how the market moves, and how everything is controlled by  Supply an Demand. Why was selling at Resistance level B better than A?

Think…………

Looking at price you can clearly see that price is in a downtrend. I have marked up the lower lows by the black circles. Now from an institutional level or retail level, price is clearly going down so everyone wants to sell the market. There is nothing to tell us otherwise. Now when we take a sell trade we need price to go lower for us to make money. The lower price goes, the more money we make. So logical thinking would be to wait for price to go higher so we can then sell it back down. The higher the price goes, the more money we make when price goes lower. In simple terms we are selling at a better price. This is exactly the difference between resistance area A and resistance area B. Resistance area A was a great place to sell the market. Price was in a downtrend and it had pulled back to an area of resistance. However selling at resistance area B would be better though. That is exactly why price dropped so fast from that level. All the experienced traders put sell orders at that level and waiting for price to come to them. As soon as price came to that level, all the sell orders got triggered and flooded the market. Resulting in price dropping fast.

So when you looking at Support & Resistance, you always have to remember these things.

  • Who is in the market. Buyers or sellers?
  • Where would traders want to enter the market?

Its important you understand this part, because it will help you to learn which Support & Resistance levels will hold and which ones will not.

Support Becomes Resistance

As I mentioned earlier, support & resistance levels are basically psychological levels where traders will buy and sell from. So naturally the levels that are most obvious will get respected the most. Many Traders will call these levels many different things, but we are going to stick to calling them Support & Resistance as its the most commonly used term.

Resistance = Resistance areas will always be found above price. When price is going up, traders will use a resistance area to sell from.

Support = Support areas will always be found below price. When price is going down, traders will use a support area to buy from.

Now as simply as that may sound, it actually gets a little more tricky. Support & resistance areas can actually be flipped and be called the opposite. So yes support can be called resistance and resistance can be called support. Your next question if you do not already know the answer is when does this happen?

Support levels will always be found below price, and resistance levels will always be found above price. However when price breaks one of these levels and travels through it, you have to essentially flip the names of these levels. For example lets say price is above a support level, and all of sudden price decides to drop and travel through the support level and head into a down trend. The support line which was originally below price is now above it as price is going down. This means that the support line is now a resistance line. Remember support is always below price, and resistance is always above it. So you can never have support above price. It will become resistance. Understanding this concept of support becomes resistance and resistance becomes support, is a key to your success as a trader. This terminology is normally referred to as COCH,BOS, Break & Retest.

All three of these terms all mean the same thing.

COCH – Change of Character. This means that price has changed direction. For example price was traveling into a downtrend, and now it has reversed and travelled into a uptrend. The character has changed.

BOS – Break of Structure. This means that price has changed direction. For example price has broken some kind of support or resistance level, and is now travelling into the opposite direction. Price has broken a structural level.

Break & Retest – This means that price has broken some kind of support & resistance level and then price has come back to retest it. For example a support level has been broken, and has now become a resistance level.

Why do we call it levels?

Have you ever wondered why some traders call it support & resistance levels and others call it lines? The simple answer to this is every trader will call it different things. I personally call it levels or zones and there is a very good and logically reason why I do this. Firstly we are traders, not artists. I cant draw a perfect straight line if my life dependent on it. In fact if you drew support & resistance lines and tried to match the lines perfectly to each candlestick so they touched, I think you would end up pulling your hair out over it!

Another good reason why drawing levels makes perfect sense is something called broker differences. The Forex market is liquid, which means the price is not originating from one single place. All the brokers, liquidity providers, foreign exchanges etc will all be quoting different prices of currency pairs. This price is constantly changing too every second of the day, so even if two traders entered the same trade at the same time on the same currency pair. They would still have different entry prices on their trades. Even though the difference is very small, its still a difference and this difference carry’s onto the charts too.

Candlesticks represent the price on the charts, from both the current and past price. So if you are drawing a support & resistance line on your charts, and waiting for that perfect touch of that line. It might not happen for you, even though price might have touched that line already. This is because brokers quote different prices all the time. If I was to say to you, put a resistance line at 1.0688 or even worse put a sell order at that level. For me I might get triggered at that level, and you might not. My resistance line on my charts will be different to yours. Your candle sticks will be different too. Not by much, but enough to cause a difference. This is why some indicators and Expert advisors work different from broker to broker because the price is different from broker to broker. My broker and platform might have the RSI Indicator overbought, while yours might not be. This is why I tend to draw support & resistance levels/zones rather than lines. We always have to factor in a small discrepancy either side.

Also this discrepancy is also great for when we enter trades as we always need to allow a couple of pips difference when we take a trade. I often see traders on You tube videos boasting about having tight stop losses of 1-3 pips. I can safely say from my experience if you have a stop loss less than 8 pips, you are a brokers dream. Most of my stop losses are around 10 pips mark. I highly doubt any trader can consistently win traders with a stop loss of 1-3 pips. If they are profitable though its only because their risk reward is massive. Meaning they are losing 9 trades to win 1 massive one.

Every time you take a trade, you will always start that trade in the negative. The negative being the brokers spread. Lets say for example you take a trade with a 10 pip stop loss and your brokers spread is 2 pips. This means instantly you are going to start the trade minus 2 pips. In fact this means your stop loss is not actually 10 pips, but 8 pips, because as soon as the trade goes minus 8 pips you will get stopped out. On top of this by the time you pressed sell on your platform, and the broker actually executed the trade, this could also be a 1 pip difference. This is caused slippage.

Slippage is when the price at which your order is executed does not match the price at which it was requested. This most generally happens in fast moving, highly volatile markets which are susceptible to quick and unexpected turns in a specific trend. The price difference can be either positive or negative depending on the direction of the price movement, if you are going long or short and whether you are opening or closing a position. If slippage were to affect your positions, some brokers would still fill your orders at the worse price.

All these factors add up to make having a tight stop loss near impossible to achieve in trading. Yes you might be able to win some trades, but consistently over the long run, it will not work.

This is why we always want to allow a buffer when we are trading. The key to be consistent is winning trades repeatedly over and over again. Making sure we mark support & resistance zones on our charts, rather than lines, and also allowing a wild stop loss to avoid being stopped out.

How big to too big?

I know I will get asked this question if I do not cover it, but how big should you be drawing your support & resistance zones? In the past I have seen traders literally draw zones 20% the size of their computer screens, and then get confused because all they can see now is the rectangle box they have just drawn. From a simple visual prospective, your zones do not want to be any larger than your small finger. The reason I say this is because it gives traders a starting point of how big their levels should be. There is no point saying draw your levels from candlestick to candlestick, because believe me some traders will literally draw support and resistance areas the size of their screen. Below is a very good example of the size you should be drawing them.