Supply & Demand Zones

In this section your going to learn the importance of Supply & Demand levels and how they are are key to your success in trading. However before we deep dive into the subject we are firstly going to review what you learnt in the previous section regarding Highs & Lows in the market. Highs & Lows are so important in trading because they represent key levels of support and resistance, which can provide valuable information about the strength and direction of the market. This is why we are going to continue with this subject until you truly understand it.

Highs and lows are important in forex trading because they provide traders with important information about the market trends and the direction of the price movement. By identifying these key levels, traders can determine the strength of the market, the levels of support and resistance, and the potential price targets for their trades. For example, if a currency pair has been consistently reaching higher highs and higher lows, this is a sign of an uptrend, which suggests that traders should look to buy the market. Conversely, if a currency pair has been consistently reaching lower lows and lower highs, this is a sign of a downtrend, which suggests that traders should look to sell the market.

 

Video 1

Video 2

Video 3

Measuring The Strength Of A Trend

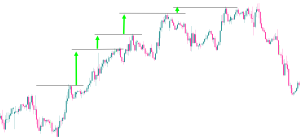
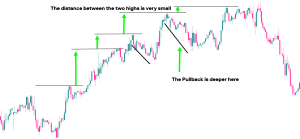
Another very good thing that Highs & Lows are good for is measuring the strength of a trend. In fact they are even better at measuring strength of trends, than indicators that are solely built for that purpose. The main reason for this is because Highs & Lows in the market are telling us exactly what price is doing at the currency situation. Its not trying to predict the market like some indicators, it is the market! From the example below you can see I have marked up the highs in an uptrend and placed a green arrow between the lines. This is showing you the distance between each high of the market. By looking at the highs or lows in the market and the distance between each one, we can gauge an idea of how strong or weak a trend is. This is called buying and selling pressure.

Remember earlier in the course where I mentioned about the market moves due to traders buying and selling the market. Well this is a good example of this. The more price goes up, and the bigger the distance between the highs means there is a lot of people buying the market. The market has strong buying pressure. The smaller the distance between the highs, means the buying pressure is getting weaker. Not only can be look at the highs and lows of the market, we can also look at the pullbacks in the market. The bigger the pullback normally means the trend is getting weaker and possible trend change or change of character is about to happen. This is why looking the skill of spotting Highs & Lows in the market is so important. Its not just a case of looking at the turning points. The rabbit hole goes much deeper than that!


Pullbacks